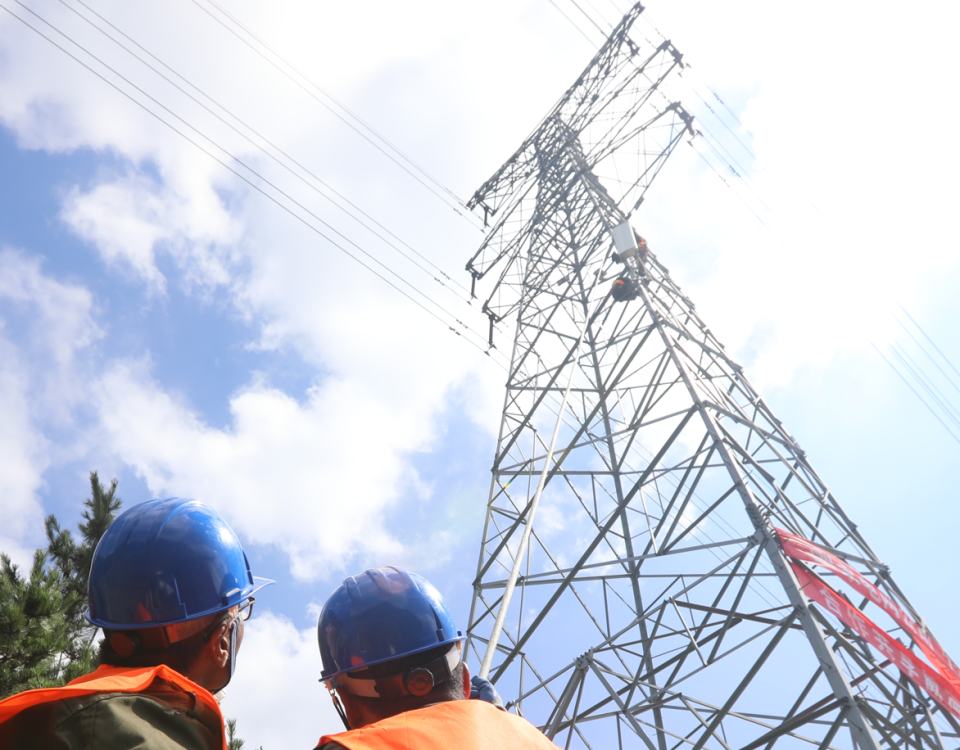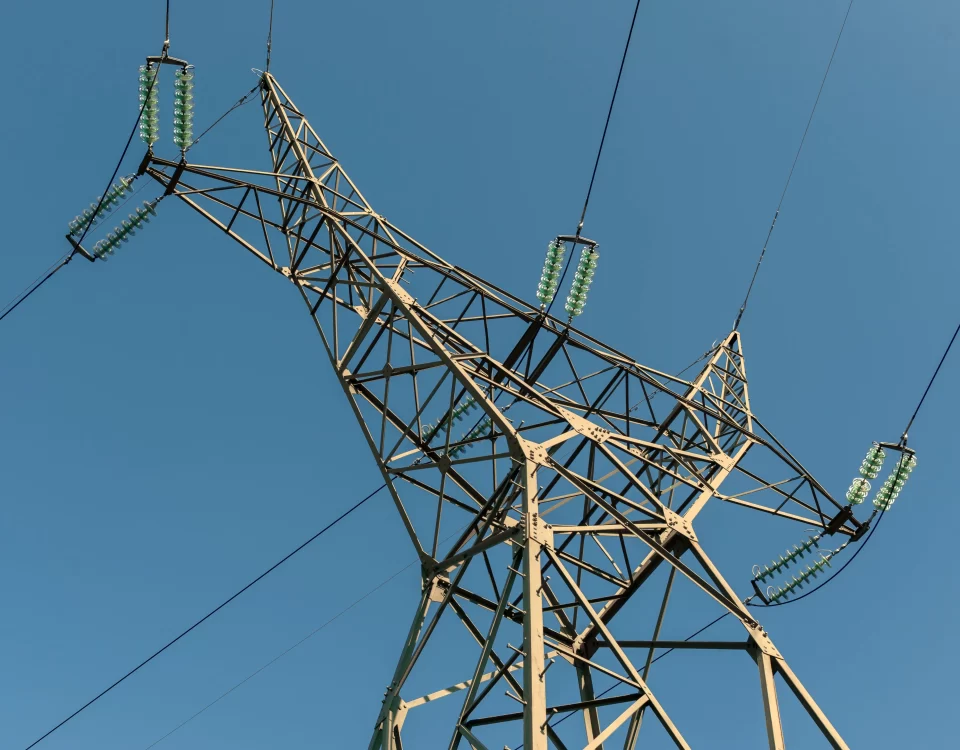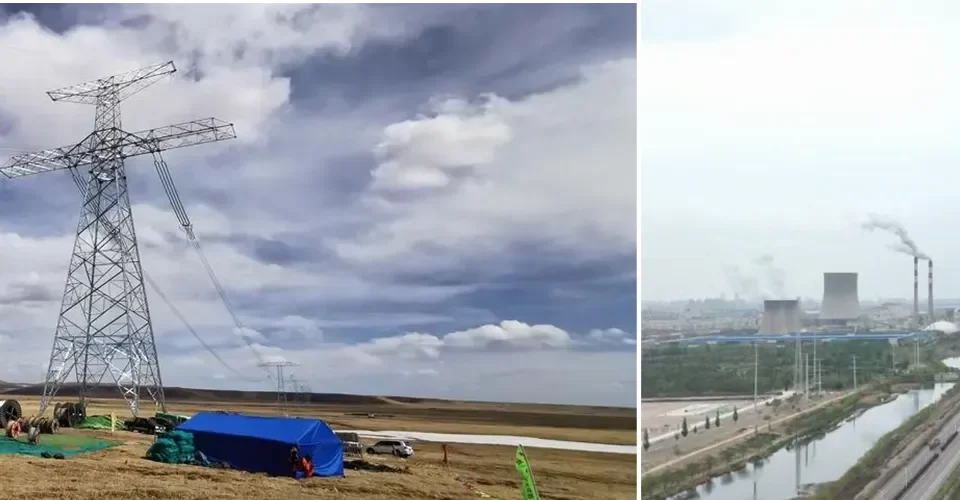
Analysis of Transmission Line Tower Subjected to Wind Loading
June 13, 2024
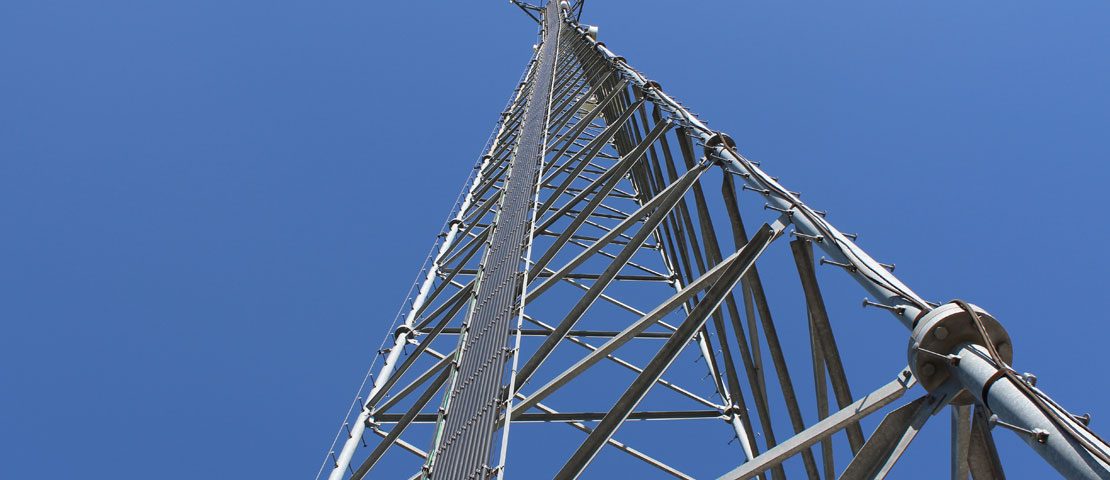
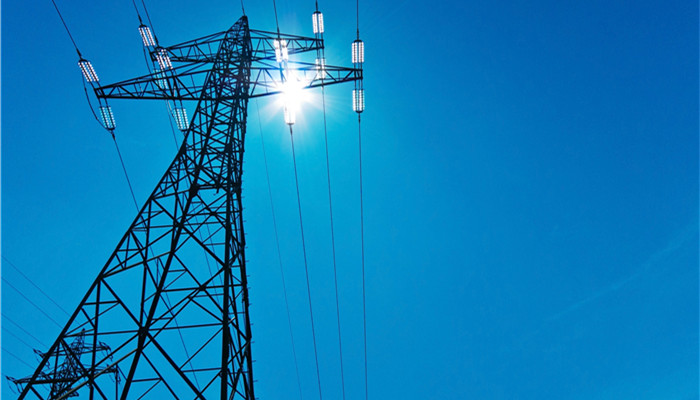
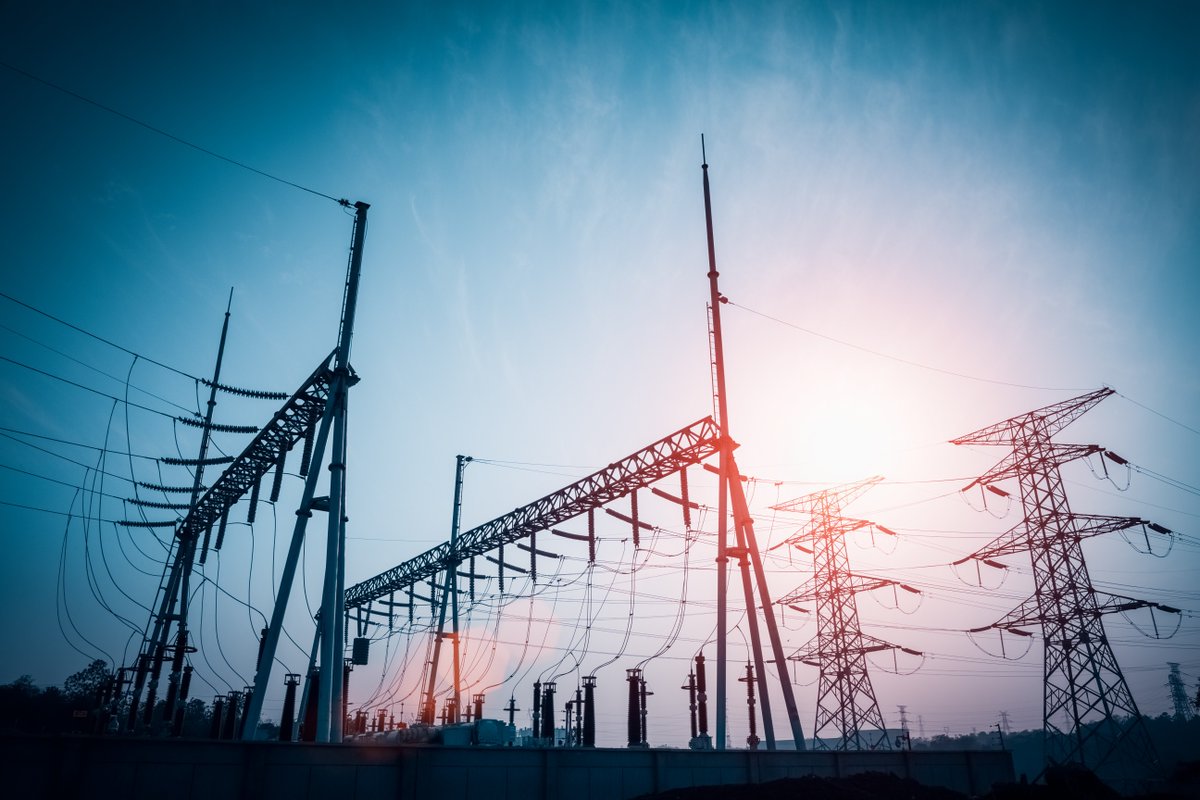
Communication Tower Lightning Protection
June 21, 2024Steel Lattice Cellular Tower Seismic Fragilities
Development of Seismic Fragilities for a Base Station Steel Lattice Cellular Tower
Seismic fragility analysis is a crucial aspect of ensuring the structural resilience of base station steel lattice cellular towers. These towers are critical for maintaining communication during and after seismic events. This comprehensive analysis involves understanding the seismic behavior, conducting structural modeling, and developing fragility curves that quantify the probability of reaching or exceeding various damage states under different levels of seismic intensity.
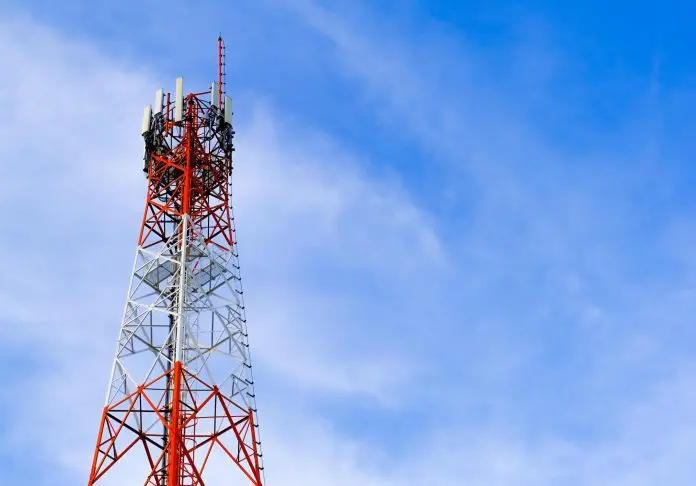
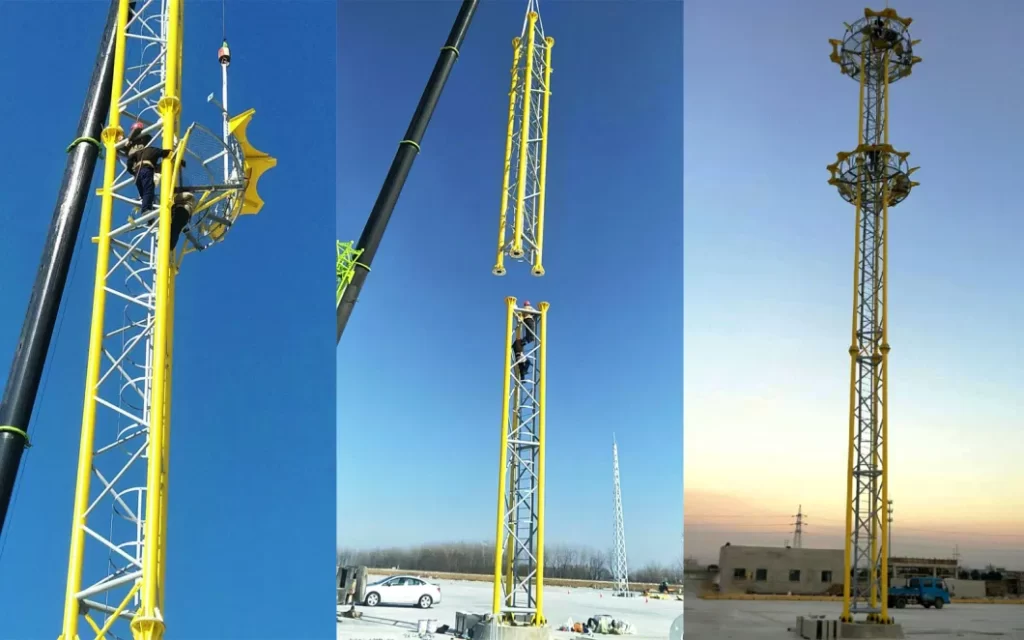
Steel Lattice Cellular Tower
Product Parameters for a Base Station Steel Lattice Cellular Tower
1. Design
- Design Code: TIA/EIA-222-G/F
2. Structure Steel
The tower can be constructed using either mild steel or high tensile steel, conforming to various international standards:
- Mild Steel:
- Chinese Standard: GB/T 700: Q235B, Q235C, Q235D
- American Standard: ASTM A36
- European Standard: EN10025: S235JR, S235J0, S235J2
- High Tensile Steel:
- Chinese Standard: GB/T 1591: Q345B, Q345C, Q345D
- American Standard: ASTM A572 Gr50
- European Standard: EN10025: S355JR, S355J0, S355J2
3. Design Wind Speed
- Maximum Wind Speed: Up to 250 km/h
4. Allowable Deflection
- Deflection Range: 0.5 to 1.0 degree at operational speed
5. Mechanical Properties
- Tensile Strength (MPa):
- Mild Steel: 360 to 510
- High Tensile Steel: 470 to 630
- Yield Strength (t ≤ 16mm) (MPa):
- Mild Steel: 235
- High Tensile Steel: 355
- Elongation (%):
- Mild Steel: 20
- High Tensile Steel: 24
- Impact Strength KV (J):
- Mild Steel:
- 27 (20°C) — Q235B (S235JR)
- 27 (0°C) — Q235C (S235J0)
- 27 (-20°C) — Q235D (S235J2)
- High Tensile Steel:
- 27 (20°C) — Q345B (S355JR)
- 27 (0°C) — Q345C (S355J0)
- 27 (-20°C) — Q345D (S355J2)
- Mild Steel:
6. Bolts & Nuts
- Grade: 4.8, 6.8, 8.8
- Standards for Mechanical Properties:
- Bolts: ISO 898-1
- Nuts: ISO 898-2
- Washers: ISO 6507-1
- Standards for Dimensions:
- Bolts: DIN 7990, DIN 931, DIN 933
- Nuts: ISO 4032, ISO 4034
- Washers: DIN 7989, DIN 127B, ISO 7091
7. Welding
- Method: CO₂ Shielded Arc Welding & Submerged Arc Welding (SAW)
- Standard: AWS D1.1
8. Marking
- Method of Marking Members: Hydraulic Press Stamping
9. Galvanizing
- Galvanization Standard for Steel Sections: ISO 1461 or ASTM A123
- Galvanization Standard for Bolts and Nuts: ISO 1461 or ASTM A153
10. Testing
- Factory Tests:
- Tensile Test
- Elements Analysis
- Charpy Test (Impact Test)
- Cold Bending
- Preece Test
- Hammer Test
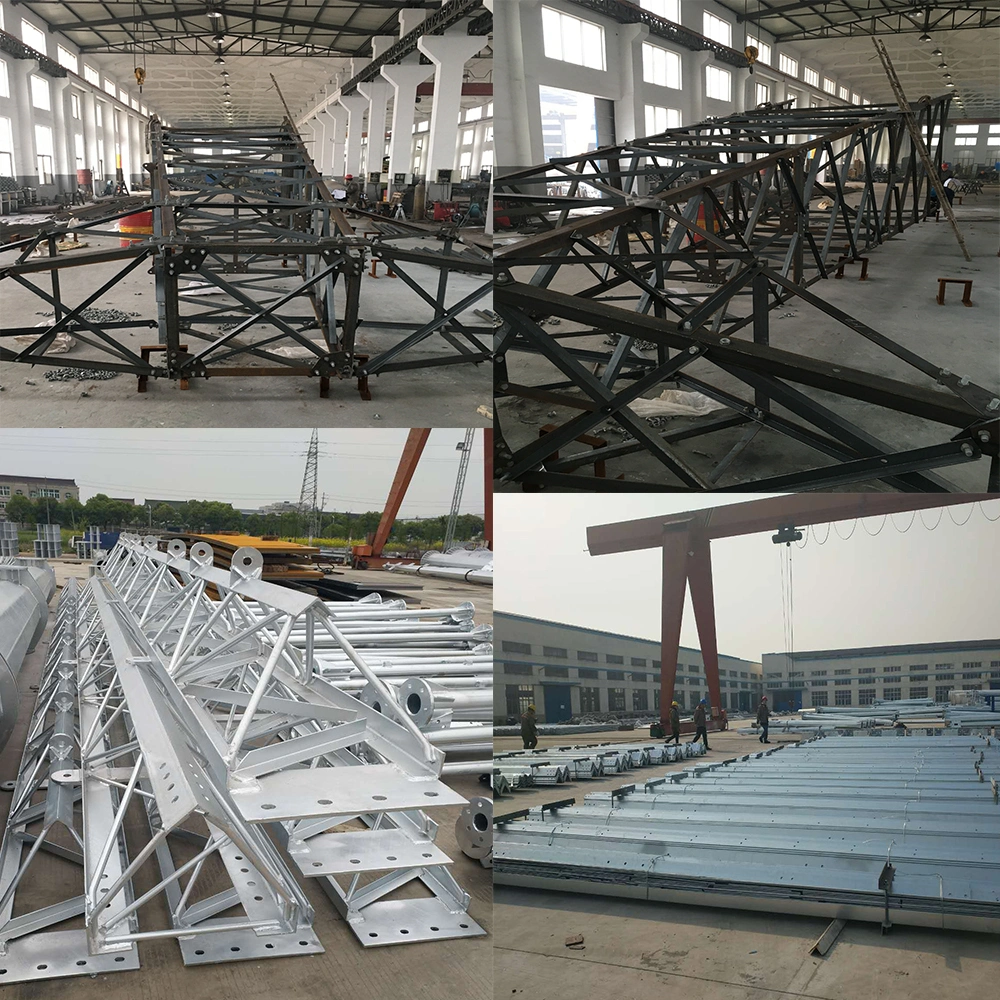
These parameters ensure the tower meets rigorous standards for structural integrity, durability, and performance under various environmental conditions. By adhering to these specifications, the tower is designed to withstand high wind speeds and seismic loads, providing reliable support for communication infrastructure.
1. Introduction to Seismic Fragility Analysis
Seismic fragility analysis assesses the likelihood that a structure will reach or exceed specified damage states under varying levels of seismic intensity. For a base station steel lattice cellular tower, this involves:
- Defining potential damage states.
- Conducting seismic hazard analysis.
- Modeling the tower’s seismic response.
- Developing fragility curves based on the probabilistic analysis of the tower’s response to seismic loads.
2. Seismic Hazard Analysis
Seismic hazard analysis involves determining the seismic intensity measures (IMs) relevant to the tower’s location. Key steps include:
- Seismic Zonation: Identifying the seismic zone and obtaining relevant seismic data such as peak ground acceleration (PGA), spectral acceleration (Sa), and ground motion records.
- Return Periods: Defining the return periods (e.g., 50, 100, 475, 2475 years) to assess different levels of seismic hazard.
- Site-Specific Analysis: Conducting site-specific seismic hazard analysis if the tower is located in a region with complex geology.
3. Damage States Definition
Damage states represent different levels of structural damage. For a steel lattice cellular tower, typical damage states might include:
- Slight Damage (DS1): Minor deformations and no significant structural damage.
- Moderate Damage (DS2): Noticeable deformations, minor yielding of members, and some connection damage.
- Extensive Damage (DS3): Significant deformations, yielding of multiple members, and damage to key connections.
- Collapse (DS4): Total structural failure or collapse.
4. Structural Modeling and Seismic Response Analysis
4.1 3D Structural Modeling
Creating a detailed 3D model of the cellular tower using finite element analysis (FEA) software such as SAP2000, ANSYS, or OpenSees. The model should include:
- Structural Members: Lattice members, bracing, and connections.
- Foundation: Modeling the foundation to account for soil-structure interaction.
- Mass Distribution: Accurate representation of mass distribution, including antennas and equipment.
4.2 Seismic Loading
Applying seismic loads to the model involves:
- Ground Motion Records: Using real or synthetic ground motion records representing the seismic hazard at the site.
- Time-History Analysis: Performing nonlinear time-history analysis to capture the dynamic response of the tower.
- Response Spectrum Analysis: Conducting response spectrum analysis for comparison and validation.
4.3 Nonlinear Analysis
Nonlinear analysis is essential to capture the inelastic behavior of the tower under seismic loading. This involves:
- Material Nonlinearity: Modeling yielding and post-yield behavior of steel members.
- Geometric Nonlinearity: Considering large deformations and P-Delta effects.
- Connection Behavior: Accurate modeling of connection stiffness and strength.
5. Fragility Curve Development
Fragility curves are developed by statistical analysis of the tower’s response to seismic loads. The steps include:
5.1 Seismic Demand Parameters
Identifying seismic demand parameters (e.g., maximum inter-story drift, base shear) that correlate with damage states.
5.2 Probabilistic Seismic Demand Models (PSDMs)
Developing PSDMs that relate seismic demand parameters to seismic intensity measures (IMs). This can be done using regression analysis on the results from nonlinear time-history analyses.
5.3 Damage Probability Matrices
Constructing damage probability matrices that provide the probability of reaching or exceeding each damage state for given levels of seismic intensity.
5.4 Fragility Function Formulation
Fitting fragility functions to the damage probability data. The fragility function is often expressed as a lognormal cumulative distribution function (CDF):
[≥∣]=Φ(ln()−ln())P[DS≥ds∣IM]=Φ(βdsln(IM)−ln(IMds))
Where:
- [≥∣]P[DS≥ds∣IM] = Probability of reaching or exceeding damage state ds given intensity measure IM.
- ΦΦ = Standard normal cumulative distribution function.
- IMds = Median value of the intensity measure causing damage state ds.
- βds = Logarithmic standard deviation representing the uncertainty in the IM for damage state ds.
6. Case Study: Seismic Fragility Analysis of a Base Station Steel Lattice Cellular Tower
To illustrate the development of seismic fragilities, we present a case study of a steel lattice cellular tower located in a seismically active region.
6.1 Tower Description
- Height: 40 meters
- Configuration: Lattice tower with four legs and cross-bracing
- Location: Urban area in a seismic zone with high seismic activity
6.2 Seismic Hazard Data
- Seismic Zone: Zone IV (high seismicity)
- Design Spectra: Based on the local building code
- Ground Motion Records: Selected from a database to match the seismic hazard at the site
6.3 Structural Modeling
A detailed 3D finite element model is created using OpenSees, incorporating the following elements:
- Structural Members: Steel legs, horizontal and diagonal bracing members
- Connections: Bolted/welded connections modeled with appropriate stiffness and strength characteristics
- Foundation: Modeled as fixed supports for simplicity, with a note that a more detailed soil-structure interaction model could be used
6.4 Seismic Loading and Analysis
Ground Motion Selection:
- 10 ground motion records, scaled to match the design spectra at different intensity levels (e.g., 0.1g, 0.2g, 0.3g, …)
Nonlinear Time-History Analysis:
- Performed using the selected ground motions
- Key output parameters: maximum inter-story drift, base shear, and member forces
6.5 Damage State Criteria
Defining damage states based on engineering judgment and structural performance criteria:
- Slight Damage (DS1): Maximum inter-story drift < 0.5%
- Moderate Damage (DS2): Maximum inter-story drift 0.5% – 1.5%
- Extensive Damage (DS3): Maximum inter-story drift 1.5% – 3%
- Collapse (DS4): Maximum inter-story drift > 3%
6.6 Seismic Demand Parameters
Key seismic demand parameters are identified as:
- Maximum Inter-Story Drift (MID)
- Base Shear (BS)
6.7 Probabilistic Seismic Demand Models (PSDMs)
Regression analysis is performed on the results from the nonlinear time-history analysis to develop PSDMs for each damage state. For example:
MID=⋅(PGA)MID=a⋅(PGA)b
Where a and b are regression coefficients derived from the analysis.
6.8 Fragility Curve Development
Damage Probability Matrices:
- Constructed for each damage state based on the seismic demand parameters and their corresponding seismic intensities.
Fragility Functions:
- Fitted using a lognormal distribution to the damage probability data.
Example fragility function for moderate damage (DS2):
[≥2∣]=Φ(ln(PGA)−ln(PGA2)2)P[DS≥DS2∣PGA]=Φ(βDS2ln(PGA)−ln(PGADS2))
Where:
- PGA2PGADS2 = Median PGA causing moderate damage
- 2βDS2 = Logarithmic standard deviation for moderate damage
6.9 Results
The fragility curves for each damage state are plotted, showing the probability of exceeding each damage state as a function of PGA. Example results might include:
- DS1: Median PGA = 0.15g, 1=0.3βDS1=0.3
- DS2: Median PGA = 0.30g, 2=0.35βDS2=0.35
- DS3: Median PGA = 0.45g, 3=0.4βDS3=0.4
- DS4: Median PGA = 0.60g, 4=0.45βDS4=0.45
7. Discussion and Interpretation
The developed fragility curves provide a probabilistic measure of the tower’s vulnerability to seismic events. Key observations include:
- Slight Damage (DS1): The tower is likely to experience slight damage at relatively low PGA levels.
- Moderate Damage (DS2): The probability of moderate damage increases significantly beyond a PGA of 0.3g.
- Extensive Damage (DS3): Extensive damage becomes probable at higher PGA values, indicating the need for robust design measures.
- Collapse (DS4): The collapse probability is low but significant at very high PGA values, highlighting critical intensity thresholds for structural failure.
8. Conclusion
Seismic fragility analysis of a base station steel lattice cellular tower provides valuable insights into its seismic vulnerability and informs design improvements and retrofitting strategies. The steps outlined in this process ensure a comprehensive understanding of the tower’s behavior under seismic loading and the development of reliable fragility curves. These curves are crucial for risk assessment and decision-making in the context of seismic resilience.
9. Recommendations for Enhancing Seismic Resilience
Based on the findings from the seismic fragility analysis, several recommendations can be made to enhance the seismic resilience of the tower:
9.1 Structural Reinforcement
- Member Strengthening: Upgrade critical members (e.g., legs and main bracing) to withstand higher seismic forces.
- Connection Enhancements: Improve the design and strength of connections to prevent failure under dynamic loading.
- Redundant Bracing: Introduce additional bracing to provide alternative load paths and improve overall stability.
9.2 Foundation Improvements
- Soil-Structure Interaction (SSI): Conduct detailed SSI analysis and design foundations to mitigate seismic forces effectively.
- Base Isolation: Consider the use of base isolation techniques to decouple the tower from ground motion and reduce seismic demand.
9.3 Retrofit Strategies
- Damping Systems: Implement damping systems (e.g., tuned mass dampers, viscous dampers) to dissipate seismic energy and reduce vibrations.
- Strengthening Existing Towers: Apply retrofitting techniques such as adding external braces or using fiber-reinforced polymers (FRP) to enhance structural capacity.
9.4 Monitoring and Maintenance
- Seismic Monitoring: Install sensors to monitor the tower’s response during seismic events and gather data for ongoing assessment.
- Regular Inspections: Conduct routine inspections and maintenance to identify and address potential vulnerabilities.
10. Future Research Directions
Further research can be conducted to refine and enhance the seismic fragility analysis of steel lattice cellular towers:
- Advanced Modeling Techniques: Utilize high-fidelity finite element models and sophisticated nonlinear analysis methods to capture complex behaviors more accurately.
- Experimental Validation: Perform shake table tests on scale models or components to validate analytical models and fragility curves.
- Performance-Based Design: Develop performance-based design guidelines specifically for cellular towers, incorporating seismic fragility insights.
- Integration with Other Hazards: Study the combined effects of multiple hazards (e.g., wind and seismic) to develop comprehensive resilience strategies.
11. Conclusion
The development of seismic fragilities for a base station steel lattice cellular tower is a critical step in ensuring its structural integrity and operational continuity during and after seismic events. By following a systematic approach to seismic hazard analysis, structural modeling, and fragility curve development, engineers can quantify the tower’s vulnerability and implement effective mitigation measures. These efforts contribute to the overall resilience of communication infrastructure, which is essential for emergency response and recovery in the aftermath of earthquakes.

